REPORT
BOX |
FUNCTION |
analyticalParametersReportBox
Image | Glossary |
Shows the values of the optimizable parameters which are used to calculate a valuation of each security and to determine whether or not a trade should be recommended. |
bestTradesReportBox
Image | Glossary
|
Shows the best trades available to the active portfolio. |
cashFlowDiscountingAnalysisBox
Image | Glossary |
Shows all analyzed cash flows for the instrument in question, with the discounting factor and net present value. |
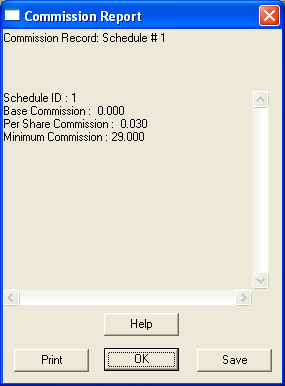
commissionReportBox
Image | Glossary |
Shows the values used to determine the commission which will be applicable for any given trade. |
componentsOfYieldCurvePriceBox
Image | Glossary |
Shows the value of each yield curve component in dollar terms that is used to calculate the "Curve Price" (or "Fair Value") of the security |
constraintsReportBox
Image | Glossary |
Shows the value of the user-defined constraints on portfolio composition. |
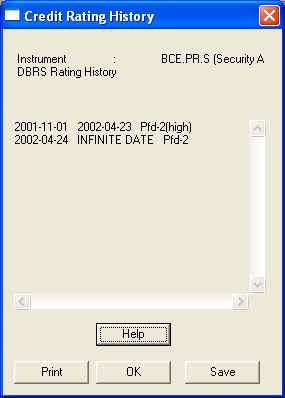
creditRatingHistoryBox
Image |
Glossary |
Shows the credit rating history of the instrument in question |
dividendsBox
Image | Glossary |
Shows the dividends that are on file as having been paid to shareholders. Note that these data are Copyright © 1993-2005 The Toronto Stock Exchange Inc. |
durationCalculationBox
Image | Glossary |
Essentially the same as the cashFlowDiscountingAnalysisBox, but also shows the dollar duration for each cash flow. |
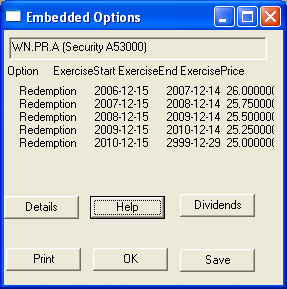
embeddedOptionsBox
Image | Glossary |
Shows the options that are embedded in the instrument in question. |
flatValueDerivationBox
Image | Glossary |
Shows the calculation of "Flat Value" — the market price of the security in question less its defined "Accrued Dividend" |
graphDataReportBox
Image | Glossary |
Shows the data set and coordinates for each point plotted on the graph |
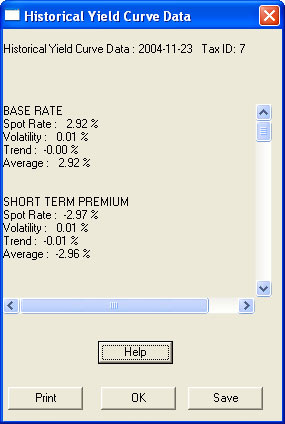
historicalYieldReportBox
Image | Glossary |
Shows the calculated spot value, average, volatility and trend of each of the components of the yield curve. |
instrumentAveragesReportBox
Image | Glossary |
Shows the calculated spot value, average, volatility and trend of each of the attributes for which a moving average is calculated for the instrument in question. |
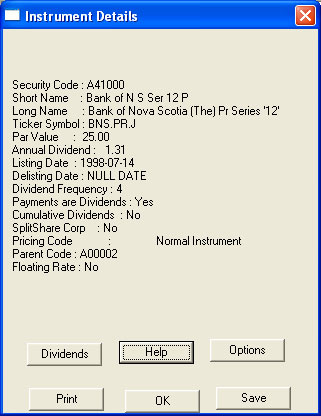
instrumentDetailsBox
Image | Glossary |
Shows the basic identifying information for the security in question. |
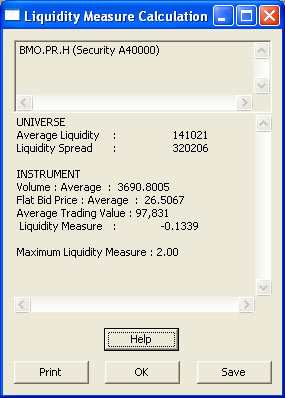
liquidityMeasureCalculationReportBox
Image | Glossary |
Shows the calculation of the liquidity measure. |
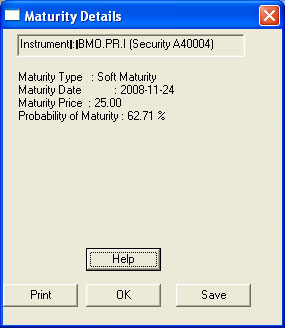
maturityDetailsBox
Image | Glossary |
Provides details about the maturity calculated for the instrument in question. |
memoryReportBox
Image | Glossary |
Of technical interest only, this report shows the memory usage of the HIMIPref™ programme during the current session. |
multipleTradeReportBox
Image | Glossary |
Useful only when the account is traded as a "Portfolio", this report shows all the iterated trades for the given day. |
optionCashFlowEffectAnalysisBox
Image | Glossary |
Shows the calculation of the cost effect of the option in question. |
performanceBox
Image | Glossary |
Provides a quick method whereby the performance of a particular return series can be displayed, with a variety of different period increments. |
pickupCalculationBox
Image | Glossary |
Shows the calculation of the valuation hurdle required before the trade in question can be recommended. |
portfolioReportBox
Image | Glossary |
Provides a quick method of examining the holdings of a particular portfolio. |
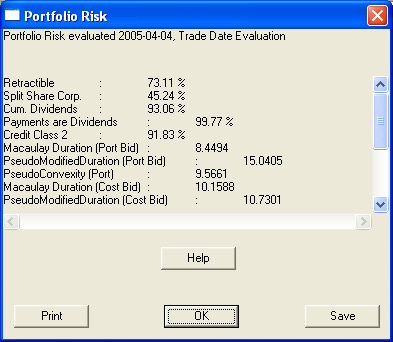
portfolioRiskReportBox
Image | Glossary |
Shows the overall composition of the portfolio in terms of the yield curve risk factors. |
pseudoConvexityCalculationBox
Image | Glossary |
Shows the calculation of pseudo-convexity, with the ability to drill down to the underlying calculations of pseudo-modified-Duration |
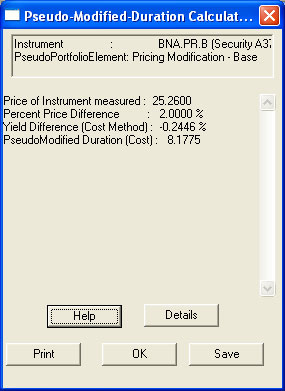
pseudoModifiedDurationCalculationBox
Image | Glossary |
Shows the calculation of pseudo-modified-duration, with the ability to drill down to the underlying calculations of yield. |
pseudoPortfolioReportBox
Image | Glossary |
Shows the calculation of the attribute in question for a particular instrument, with the weighting applied to the value for each pseudo-instrument. |
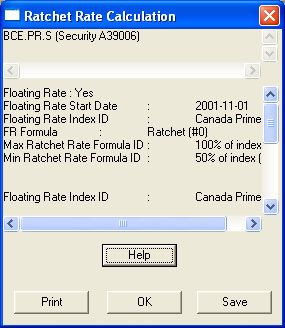
ratchetRateCalculationBox
Image | Glossary |
Shows the calculation of the "Ratchet Yield" used in the calculation |
regressionResultBox
Image | Glossary |
Shows the results of the regression in question. |
riskMeasurementCalculationBox
Image | Glossary |
Shows the calculation of "Risk Distance" in "Risk Space" |
riskPerformanceBox
Image | Glossary |
Shows the average returns for instruments of each class of risk over the defined period. |
riskRewardAnalysisBox
Image | Glossary |
Shows the calculation of the Valuation of the security in question and allows drilling down to the underlying attributes for each component's calculation. |
riskRewardAnalyticalValuesBox
Image | Glossary |
Shows the values of the attributes used to calculation valuation, arranged by valuation component. |
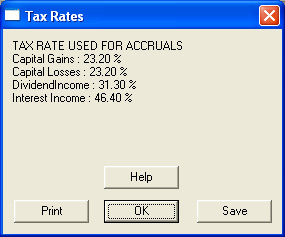
taxRateDialogBox
Image | Glossary |
Shows the tax rate used to perform calculations for the portfolio in question. |
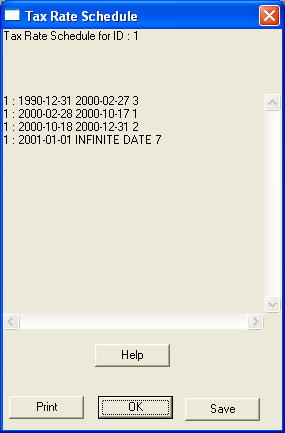
taxRateScheduleBox
Image | Glossary |
Shows the tax rate schedule (which is used to determine the changing tax rate for a given taxable situation over time). |
tradeEvaluationReportBox
Image | Glossary |
Shows the top-level calculations performed in the course of determining whether the trade in question is recommended. |
tradingFrictionAnalysisBox
Image | Glossary |
Shows the calculation of the frictional elements used in developing trade recommendations: Capital Gains taxes and Commissions. |
userSettingsReportBox
Image | Glossary |
Shows the user defined values used to personalize HIMIPref™ |
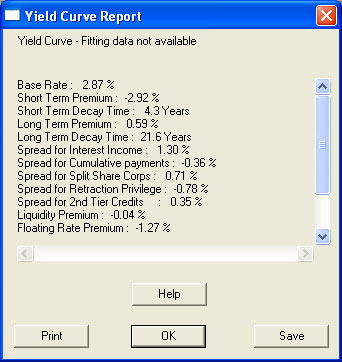
yieldCurveReportBox
Image | Glossary |
Shows the yield curve, without showing the historical averages. |

